


« Risk Management in Three Simple Steps
risks as chart

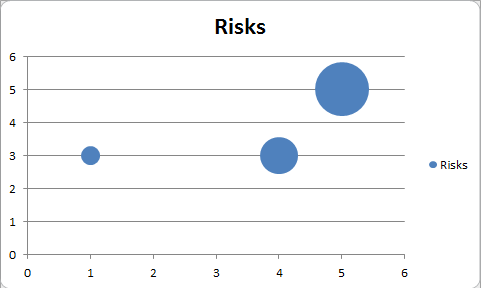
Displaying risks in a chart will help give a better understanding of the risks. This chart uses the same data as the table above. Using a bubble chart will have a double impact. Higher risks will have higher bubbles but also be shown more to the upper right. Lower risks will be shown as smaller bubbles and to the lower left.
Risks shown as a bubble diagram. Higher risks are bigger bubbles and towards the upper right corner.