


avg daily views for new clips on arch corner
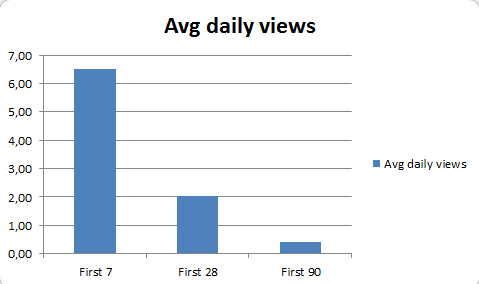
The number of views seems to be exponentially decaying for most videos we share on Architecture Corner. Probably, this is true for many other types of content as well.
A bar chart showing how many views a clip on architecture corner gets in the first week (6,5), the rest of the first month (2) and the rest of the first quarter (0,5).